Let’s develop a math project to challenge students who have demonstrated a mastery of multiplication and are ready to explore its applications.
Previously, I wrote about constructing math projects with four criteria:
- Authentic Data
- Interesting Conflict
- Think Like An Expert
- An Awesome Product
Authentic Data
A great project starts with some perplexing starting point that naturally engages students’ curiosity.
A practical application of multiplication is quickly counting large numbers of objects arranged in a pattern. And where do we see large numbers of objects arranged in an array? How about parking lots?
As a Californian, the parking lot that stands out to me is Disneyland’s enormous “Mickey and Friends” structure.
I fired up Google Maps, Bing Maps, and Google Earth and searched for the best imagery of Disneyland’s parking structure.
If Disneyland doesn’t suit your needs, here’s a list of other large parking lots.
Get Them Talking
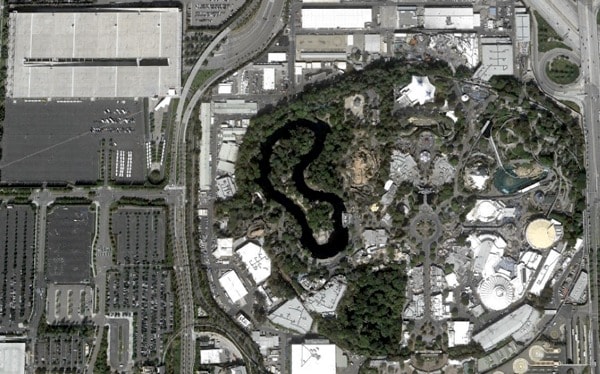
First, let’s be a bit theatrical and show a mysterious picture to get them talking:

What is this? Where is it? What’s its purpose? Let them wonder. Let them make guesses. Draw them into the mystery. Encourage curiosity, even if it’s not directly related to the eventual lesson.
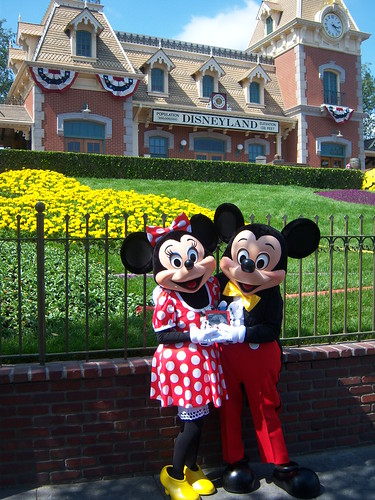
Then reveal the next image:

Can anyone figure it out now? More guesses.
It’s where everyone parks when they go to Disneyland!
Elapsed time: 3 minutes or so, and they should be pretty engaged.
Interesting Conflict
Now reveal the detailed image of the parking lot (Here’s a much larger version).

Set up the conflict that everyone’s thinking:
How many cars can park in this structure!?
Use number eight of Dan Meyer’s ten principles for engaging math tasks: “Ask for guesses.” Write their guesses down for later. Again, we’re increasing students’ stake in the process. You might also ask: What’s too small? What’s too big?
Then get down to business and ask students how they’d solve this. Strategies may include:
- Count them all
- Count per row and multiply by the number of rows
- Use the light posts to set up regions, count, then multiply by the number of regions
- Use the big white lines to divide the regions
- And so on.
On With The Show
Group students (or let them work alone) and give out copies of the image of the structure.
Depending on their ability, ask them to solve using two or three different strategies. This will set up the question: “Which strategy was best, easiest, or most accurate?”
Give them some structure as they work:
| Method | Evidence | Solution | Pros/Cons |
|---|---|---|---|
| Counted rows | 160 × 10 | 1600 | rows are long and difficult to count |
| Counted sections within white lines | 6 × 290 | 1750 | sections at the ends are not equal |
Here’s a blank PDF of this table.
Walk around and monitor, probing when someone goes astray. Work with groups that you know need help. Note that requiring different methods is a way to differentiate. If a group struggles with multiplying these larger numbers, ask them for only one method.
Three Dimensions!
Once everyone has at least one solution, introduce the next piece of information:

Ask them what important detail they need to consider now. There are six levels to the structure! We’ve only calculated part of the solution! Time to multiply again!
You’ve Gotta Know the Answer!
As we approach the conclusion, make sure you know the actual answer. Otherwise, it’s the ultimate anti-climax! The contractor has the exact answer: 10,242 cars!
But! That’s Not What We Got!?
Did anyone hit the bullseye? Probably not! But that means we can ask: “Why didn’t we get the answer perfectly?”
Let students think about it.
- Maybe the floors we can’t see are slightly different than the roof?
- Maybe certain spots aren’t “parkable”?
- Maybe floor one is completely different since it’s the entrance to the lot?
Discuss the accuracy and usefulness of each strategy.
Extend It: Economist’s Perspective
We can extend this further by applying an economist’s point of view.
How much money does Disneyland make off its parking structure when it’s full? At 50%? And so on.

I even dug up the original cost of the structure: $90 million. With this information, we can ask about the profitability of the parking structure.
How many days of a full parking lot are necessary to pay off the $90 million price tag? What if the lot was only 75% full?
Going further: What range of people could the lot hold? Consider motorcycles through vans. How much money in ticket sales would the lot generate?

As an economist, was the initial investment into this parking structure worth it?
Product
Students could develop the following:
- An attack ad criticizing the expensive project
- A recommendation for Disney to change pricing to reach profitability faster
- An brochure offering information and graphs about the structure for Disney investors
As always, products should tap into students’ natural talents and interests.
Your Thoughts
I’d really appreciate your feedback on this. Try it out with your students and let me know how it went: ian@byrdseed.com

