Here’s an idea to integrate two-dimensional graphing with deep character analysis. Use the right characters, and you’ve got an exciting debate on your hands. Plus, it leads to a beautiful product that’s perfect for Open House.
Come up with two criteria for ranking characters. These should be somewhat subjective. Below I’m using “morality” and “physical strength” because these leave some room for disagreement and ambiguity. Don’t use totally objective criteria like “height” vs “weight” or “age”. Every kid would come up with the same graph, which is boring.
Then, pick some characters that have different levels of these characteristics.
Finally, ask students to place each character on the graph, with x- and y-axes representing the two criteria.
Here’s an example:
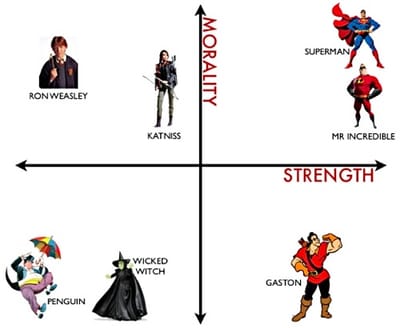
I used the following characters:
- The Wicked Witch of the West, The Wizard Of Oz
- Gaston, Beauty and the Beast
- Mr. Incredible, The Incredibles
- Katniss Everdeen, Hunger Games
- Ron Weasley, Harry Potter
- Superman, Superman
- The Penguin, Batman
My Justification
When we have subjective criteria
The Wicked Witch isn’t physically powerful, she relies on an army of monkeys and is easily defeated by a bucket of water.
She is, however, more powerful than The Penguin, due to her magic. Gaston is certainly the most physically powerful of the three characters with low morality.
Superman and Mr. Incredible are equally powerful, but Mr. Incredible has several moral lapses that move him down the y-axis.
Neither Katniss nor Ron are physically strong, but both have high levels of morality. I put Katniss a bit lower, due to her controversial love triangle :)
Quadrants
Let’s increase the math connection by labeling the four quadrants.
- Quadrant I: Heroes – Powerful, morally strong characters.
- Quadrant II: Underdogs – Physically weak, but morally strong characters.
- Quadrant III: Masterminds – Physically weak, evil characters.
- Quadrant IV: Brutes – Powerful, evil characters.
Did you disagree with my placement? Great because your students will disagree also, and they’ll get into a fascinating discussion about character analysis.
Other Criteria
Looking for some more ways to graph characters?
- fear
- pride
- courage
- knowledge
- happiness
Naturally, your students are going to come up with even better ideas for graph characters.
Line Graphs
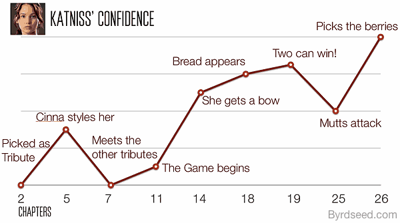
But what if we go beyond the two-dimensional scatter plot? The line graph is perfect for showing a character’s change over time. Here’s Katniss’ confidence as it changed across The Hunger Games.
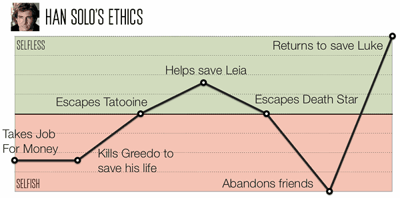
And here’s the ethics of Han Solo’s actions across Star Wars, ranked from selfishness to selflessness.
Imagine looking at historical figures across time or comparing multiple characters on the same graph.
The criteria could include:
- happiness
- leadership
- success
Bar Graphs
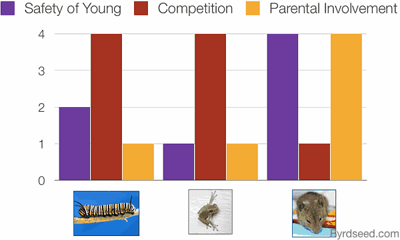
In another article, we helped students form strong opinions of the “best” life cycle amongst frogs, butterflies, and mice.
A bar graph can help students visualize the categories they’re using to form an opinion. We used the following categories:
- Safety of young
- Competition for food with adults
- Parental involvement
In each category, students rank the life cycles on a scale of 1 – 4. Here are my results:
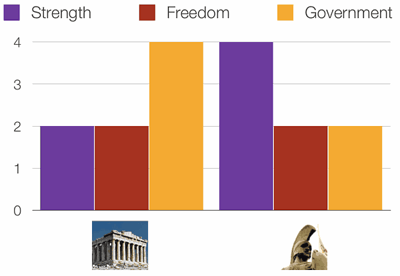
We could use the bar graph to form opinions in social studies, as well. If students are choosing Sparta or Athens as the best, they can compare strength, freedom, and government:
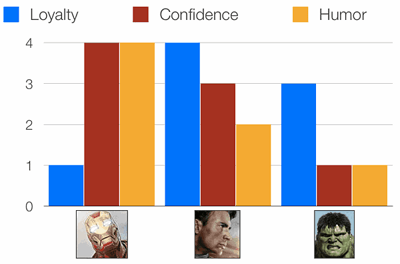
And bar graphs could also apply to characters’ traits, as seen here with three members of The Avengers:
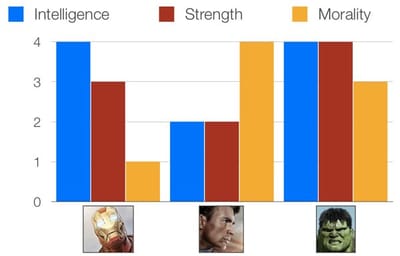
Of course, if you change the criteria, the graph might change drastically, emphasizing how different criteria strongly affects the final decision:
Explanations Needed
Naturally, you’d expect an explanation along with these visual representations:
Sparta ranks the highest in strength because of their legendary army. Athens, although not as strong, is no slouch thanks to their powerful navy. Sparta and Athens both rank in the middle in terms of freedom. Athens held elections, but denied women and slaves rights. Spartan women had more rights, but did not hold elections. Finally, Athens’ democratic government beats Sparta’s kings.
The Product
Let students pick five characters from a huge list. Have students create graphs using cutout characters, printed graphs with color printers, or hand-illustrated creations. Include brief explanations for each character.
If you’re up for the challenge, let students chose a third criteria and build 3D graphs to hang around the room.
