You may not know, but I keep a list of [links with intriguing math data here](https://www.byrdseed.com/data). Anytime I read an article or spot a graphic that contains a potentially cool math application, I bookmark it. I’d like to feature three of my favorite examples here.
Ideally, this data would inspire a math project that connects with your grade levels content and extends naturally beyond math into language arts, social studies, art, science, sports, and music.
Box Office Vs Critical Acclaim
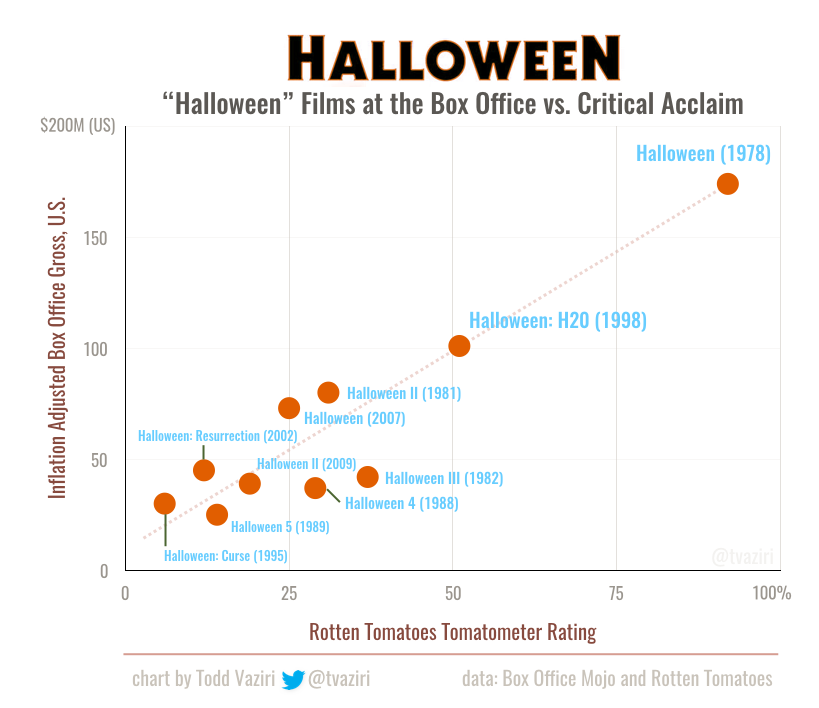
This graphic, created by special effects artist Todd Vaziri, compares the box office performance of the Halloween movies with their critical acclaim using a scatter plot.

Obviously, horror films aren’t the best content for the classroom, but imagine duplicating this idea but using the Toy Story, Star Wars, or Marvel films. What patterns might we uncover? What predictions might we make? How could students extend this idea? Is there a relationship between how “good” a movie is and the money it makes? What about the date the film came out? Add in the idea of inflation to study how the dollar has changed over time.
Data is easily obtainable from Rotten Tomatoes and Box Office Mojo for most films.
Gasoline Is Cheap
This article from David Pogue at the New York Times posits that “compared to other liquid, gasoline is cheap“.
What an intriguing statement! We usually moan about how expensive gas is, but I had certainly never thought to compare it to other liquids. How much is milk per gallon? Bottled water? Mouth wash?
What a great opportunity to work with ratios, convert units, and uncover unexpected truths!
Caloric Density
How much space can 500 calories take up in your stomach? This graphic from Knives Over Forks shows five different possibilities.

What foods would students want to investigate? And how might they display their findings? What foods balance deliciousness and caloric density?
See also: What 2,000 Calories Looks Like showing photos of a day’s calories from various restaurants.
For more data check out my bookmarks, but also read my series on creating meaningful math projects.
